-
SERVICES
- Gravity » AIRGrav
- Marine AIRGrav
- Magnetic Total Field
- Magnetic Gradient
- Radiometrics
- Frequency-Domain EM
- Geoid Applications with AIRGrav
- Scanning LiDAR
- Methane Sensing
- Multi-Parameter Surveys
- Environmental Monitoring
- Baseline Monitoring & Contamination Detection
- Data Interpretation
- Navigation » SGNav
- Drape Flying » SGDrape
- Quality Control
 |
|---|
 |
 Multi-Parameter SurveysExploration success is vastly improved by using a multi-parameter approach, whereby several complementary geophysical techniques are used together to maximize subsurface information. Sander Geophysics owns and operates two DHC-6 Twin Otter survey aircraft that are capable of acquiring multiple geophysical parameters simultaneously. These parameters include frequency domain electromagnetics, gravity, magnetics and gamma-ray spectrometry, which can all be used together to provide a more complete geological picture. Associated aircraft GPS data as well as radar and laser altimeter data are also recorded. 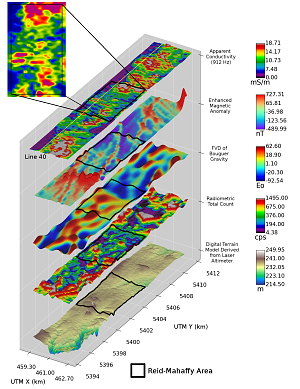
Figure 1: Reid-Mahaffy test site data showing multiple data compone Multi-Parameter DataThe electromagnetic data is provided by SGL's SGFEM system, which is designed for high resolution mapping, and consists of a four frequency (925, 3,005, 11,962, and 27,933 Hz) transmitter mounted in a wingtip pod and a receiver mounted in a pod on the opposite wing. Gravity data is provided by AIRGrav, a total field gravimeter designed and built by SGL specifically for the airborne environment, which is mounted inside the aircraft cabin. A total field magnetometer mounted in a rigid tail stinger provides the magnetic data, and a gamma-ray spectrometer with up to 3 boxes (50.4 litres downward facing, 8.4 litres upward facing) of sodium iodide crystals provides the radiometric data. 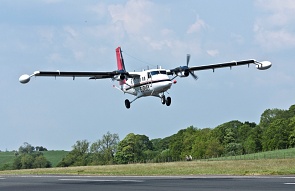
SGL´s de Havilland Twin Otter on survey in Ireland Reid-Mahaffy Geophysical Test SiteA survey using this multi-parameter system was flown over the Reid-Mahaffy geophysical test site in Ontario to demonstrate the system's capabilities over a typical mineral exploration target with known geology and good depth control. Using a primary (traverse) line spacing of 200 m, a total of 315 line kilometres were flown over the test site and surrounding area at a speed of 90 knots (167 km/h) and at an altitude of 52 m. Specialized Processing & InterpretationThe Reid-Mahaffy data were processed using SGL's suite of processing tools, and an analysis of the data was performed. Figure 1 shows the complementary nature of multiple instruments. The first grid is the apparent conductivity derived from the lowest frequency (912 Hz) which tends to target deeper conductors. The principal conductors of the Reid-Mahaffy area are clearly visible and delineated by the east-west striking conductive zones in the centre of the area. The magnetic anomaly grid shows magnetic bearing targets, especially useful to delineate certain dykes. The first vertical derivative of the Bouguer gravity grid supports the other data sets by imaging density contrasts which can help map geological units and contacts. The radiometric data can potentially identify geological units by measuring the quantity of radioelements (potassium, uranium and thorium) common in many rocks where they are outcropping or where in situ soil is present. Finally, a high quality digital terrain model can be derived from the laser altimeter showcasing very detailed terrain. Figure 2 shows a cross section of Line 40 (location shown in Figure 1) that crosses over the conductors of interest. The top pane shows the radiometric data, and the second pane shows the first vertical derivative of the Bouguer gravity combined with the magnetic anomaly data. The bottom pane is a Conductivity Depth Image (CDI) whereby all frequencies from the SGFEM system are used to generate a suite of conductivity values with associated depths. The result is a relatively fast product that can help localize targets of interest, and can even map overburden thickness due to the great near surface resolution of the SGFEM system. The CDI clearly shows multiple conductors that correlate with the apparent conductivity data. In some settings, various parameters may correlate to each other (either directly or inversely), or one may image a feature that the others do not by mapping a different rock property. A much better interpretation can be generated by having all of these tools to provide a more complete geological picture. 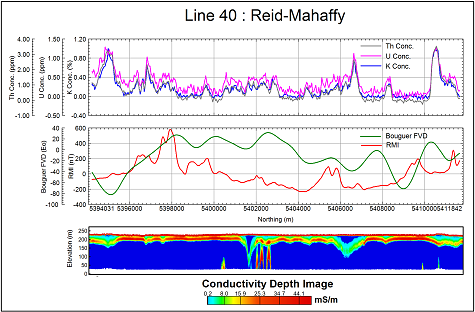
Figure 2: Test line showcasing multiple parameters in profile plus CDI generated from SGFEM system |