-
SERVICES
- Gravity » AIRGrav
- Marine AIRGrav
- Magnetic Total Field
- Magnetic Gradient
- Radiometrics
- Frequency-Domain EM
- Geoid Applications with AIRGrav
- Scanning LiDAR
- Methane Sensing
- Multi-Parameter Surveys
- Environmental Monitoring
- Baseline Monitoring & Contamination Detection
- Data Interpretation
- Navigation » SGNav
- Drape Flying » SGDrape
- Quality Control
 |
|---|
 |
 Interpretation of Airborne Geophysical DataThe interpretative skills at SGL have been developed in numerous projects over the last two decades. The general format followed for each project is:
At SGL we realize the importance of data interpretation in order to maximise the usefulness of airborne geophysics. For this reason, interpretation projects are carried out by experienced geophysicists, under the supervision of the management of the company. There are three main aspects of any interpretation, 1) methodology, 2) tools and 3) the interpreter, each of which are essential for the quality of the product. The following paragraphs address each of those areas. MethodologyBackground ResearchDuring the stage of background research of each interpretation project, all known sources of geophysical and geological information of the area of interest are investigated and reviewed. This includes a literature search, review of available seismic and well log data, other potential field surveys, remote sensing data, and other sources of information. Two main questions to be addressed during the background research are:
A review of analogous areas can also be very useful. With this information the interpreters can work from the existing data base to get the best value from the potential field data. Study of the DataEach data set has its own peculiarities. Before actually starting to interpret the data, it is worthwhile to spend some time to find out as much as possible about the data. This includes:
Data Processing to Enhance DataThe amount of data processing needed for a successful interpretation depends on the state of the data and the desired products of the interpretation. The data processing facilities at SGL are equipped for all aspects of compilation and processing of all types of airborne geophysical data. A full suite of software is maintained in-house, for maximum flexibility and control over the final product. In addition to the normal steps of data compilation, such as those listed above, SGL also offers more specialized procedures, such as:
SGL specializes in processing of navigation data, including enhancement of data by differential Global Positioning System (GPS) and the optimal integration of various types of navigation instruments. Data PresentationOnce digital line data of adequate quality are available, the data must be prepared for presentation to the user. A wide variety of presentation methods are available at SGL including the following:
Data can be gridded using a minimum curvature, cosine weighted average or an Akima spline gridding algorithm. The best method of presentation depends on the data set and the interpretation goals. ModellingMost interpretation projects are based on modelling. At SGL we use three main modelling methods:
Very often, we use all three. The Werner profiles are a good starting method. They are fast and automatic, and provide a quick and unbiased view of what basement might look like. Unfortunately they are also ambiguous and subject to misrepresenting the depth to basement in some situations (i.e. near the ends of lines, over the edges of anomalies, for very low frequency anomalies, and in noisy data). For a detailed study, we prefer forward modelling. Model parameters such as depth size and location of buried bodies, intensity and direction of magnetization or density of each body, are estimated using the results of the background research. The 3-D modelling program is used to automatically refine the model parameters, minimizing the error between the theoretical and observed data. The 2.5-D modelling program can be used to interactively investigate complex modelling situations. The forward modelling procedures help us to define the basement topography and structure and delineate any intra-sedimentary magnetic features. 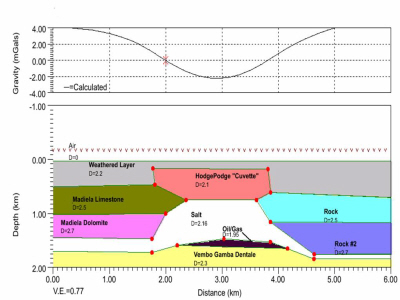
Gravity model of a sub-salt Preparation of Interpretive Maps and SectionsDuring and after the modelling process the results are analyzed, and interpretive maps and sections are prepared. It is often useful to go back to the modelling process during this stage to resolve questions which arise while preparing maps or sections. Documenting of ConclusionsConclusions of an interpretation project can include ideas concerning the relationship of the local features with the regional structure, the nature of magnetic basement, and the tectonic history of the area. They are the result of a synthesis of the entire project from background research to the preparation of interpretive products. Preparation of a Final ReportThe report for each project explains each activity in the interpretation process, and includes samples of the data, models and interpretive products and conclusions of the project. ToolsSoftwareSGL maintains a full suite of proprietary software for the compilation and processing of geophysical data. The modelling programs are partially based on work by the GSC, the USGS, and recent scientific publications. SGL employs geophysicists, physicists, mathematicians and computer scientists engaged in developing new programs and maintaining and enhancing existing software. Sander Geophysics also uses current versions of third party modelling software such as Geosoft GM-SYS 3D. HardwareThe SGL computing center is equipped with PC based work stations connected by a local area network as well as facilities for plotting colour and contour maps. InterpretersInterpretation projects are carried out by experienced geophysicists under the supervision of the company management. The staff at SGL includes individuals with a wide range of education and experience in geophysical and geological interpretation. SGL maintains a staff of adequate size to provide a high quality and timely interpretation of potential field data. |